Blog June 1, 2018
Power BI & Azure Streaming Analytics - a Powerful Integration


- Topics
- Data & Analytics
What is streaming analytics?
As the first part of its name implies, streaming analytics is the process of monitoring, examining, and gaining insights
from streams of high-volume
data. For the most part, we are not concerned with storing all of these data points, but merely performing some
sort of analysis on our data as it passes through our watch. With the advent of Internet of Things, a seemingly endless
array of social media feeds, and other voluminous data sources, there are ever-growing possibilities out there for real-time
analysis of new types of data. While there will surely always be a place for the planned, meticulously built, constantly
growing data warehouse, streaming analytics can be used to great effect for quick insights, live pattern analysis, and
real-time dashboarding.
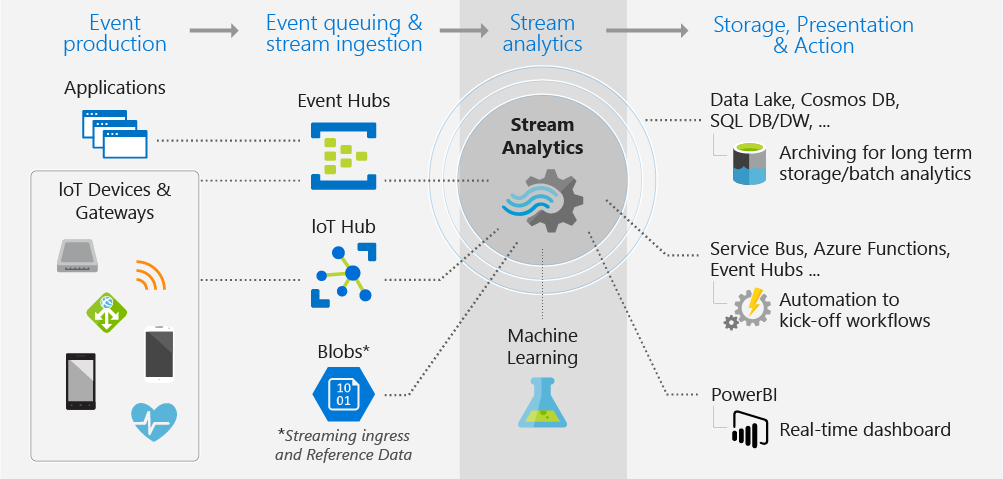
The architecture below (image links to source) shows a 'typical' Stream Analytics pipeline / architecture using Azure Streaming Analytics, among other Microsoft tools. Let's consider an example: Uber streams all trip travel times between the airport and major tourist destination for several major metropolitan areas.
Benefits of Azure Streaming
One of the most appealing features of using Azure as your streaming analytics platform is the ability to use a variation of MS SQL to shape the raw streaming data into information. With only a few additional keywords, time-series based analysis can quickly be whipped up on live data. In the example below, we are examining average trip time per city-origination-destination, using a 30-minute window (HoppingWindow) gathered every 5 minutes.
select city
 ,origination
 ,destination
 ,AVG(trip_time)
into PowerBI
from AzureStream
where city in ('New York', 'Chicago', 'Charlotte')
 and destination = 'Airport'
group by 1,2,3
HoppingWindow(minute,5,30)
Additionally, Azure makes directing the output of the analyzed data stream very easy. For instance, streaming the live data into Microsoft Power BI requires only a few configuration staples, including adding the Azure Streaming Event Handler as an Authorized source within your Power BI instance. Once configured, the simple addition of "into Power BI" (assuming you named the configured output Power BI) to the script sends the streaming data to your front end visualization tool as if it were any other 'static' data source.
What to do with all these steaming insights?
Once you have your data stream all dressed up the way you like it, Microsoft's Power BI tool offers a wide array of quick-to-implement visualizations to display your analysis. Similar to Tableau, the tool is essentially 'drag and drop.' However, Power BI offers an incredibly promising new feature called Q&A - a natural language search bar. By typing in a regular sentence, such as "Average time to get to Charlotte's airport from downtown as a line graph for the past 30 minutes," Power BI will display a chart similar to below, if asked at 5:00pm, and at 5:30pm.

Peering at the above information through the lens of practicality, the progression of average trip times could be displayed in a live dashboard, in a hotel lobby for instance, so that fresh data is automatically displayed as soon as it is ready. Seeing such a drastic jump in trip time, from 30 to 50+ minutes, in such a short time would very likely have an influence on personal behavior. Beyond increasing traveler convenience, other delivery / logistics companies could use similar tactics to monitor real time traffic, and alert drivers to alter course to increase fuel economy.
Streaming data services, and the ability to analyze, curate, and display the results in real-time presents many opportunities to add value to daily life, both at the micro and macro levels. Using the right tools, especially ones that are designed to work in concert, only heighten the experience and lower the barrier to delivering insights.

