

With the recent release of Tableau 2019.2, I thought it would be fun to go through some of, what I think, are the most useful new features.
Tableau tries to stick to one release a quarter and they are typically highly anticipated. I think some of that anticipation is driven by the fact that Tableau strives to take user suggestions into account when developing new features (check out the ideas section of the Tableau Community to see what people are asking for). For those of us who have been using Tableau for some time, you’ll notice that 2019.2 has several features that the community has found ways to ‘hack’ with previous versions (show/hide containers for example).
The features that I’ll be reviewing are:
- Parameter Actions
- Show/Hide Containers
- Replace Worksheet in a Dashboard
Parameter Actions
Tableau has been constantly pressured to release dynamic parameters, and I think this is their way to, although only slightly, appease the mob.
While parameters are still not fully dynamic, you can now set a parameter to a specific value based on a dashboard or sheet selection. Below I outline some of the cool ways that I’ve started to use parameter actions to make my dashboards more interactive and impactful.
The first use of parameter actions that I found to be useful is the ability to filter across data sources without blending. With previous versions you could use filter actions to easily filter across data sources used on a single dashboard, but what if you wanted to filter across different dashboards? Parameters have always been a great way to filter across dashboards and data sets because they are more performant than blending, but until now those parameters had to be set by a drop-down, slider, or radio buttons.
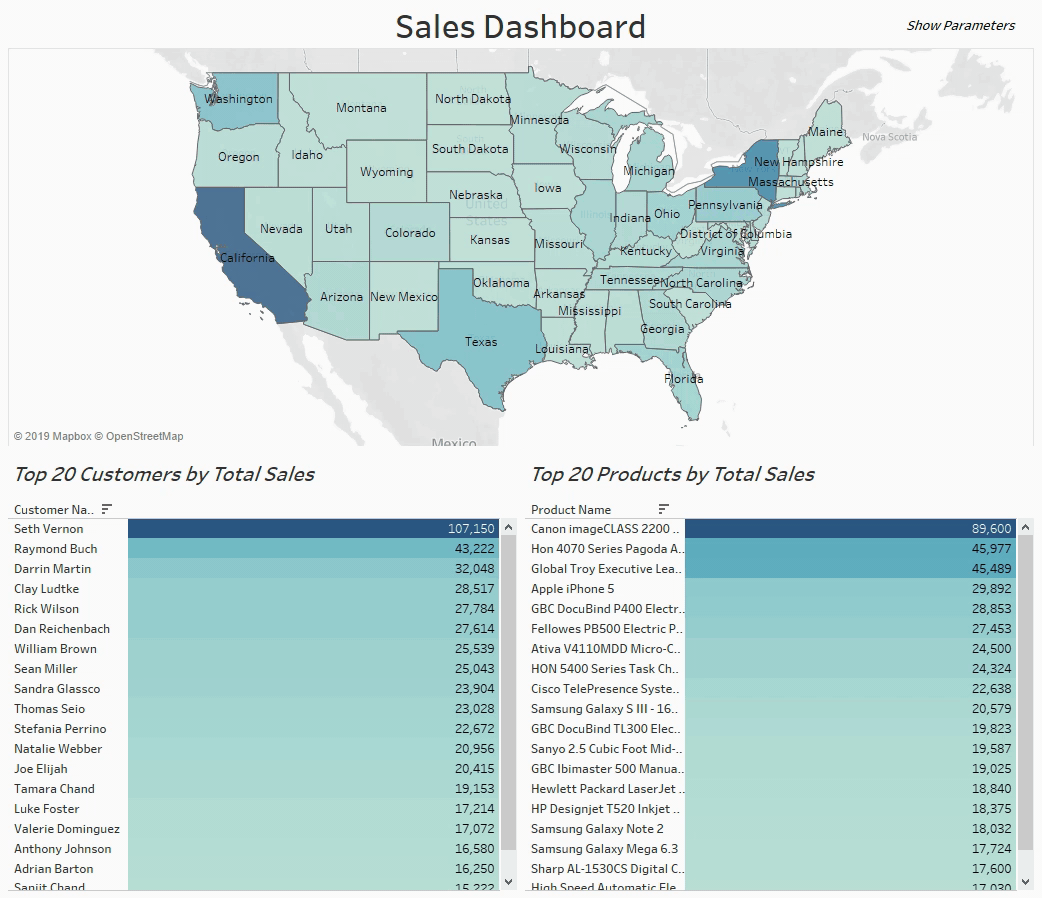
In the below example, I have two dashboards, a Sales Dashboard, and an Orders Dashboard. What I want is to filter the Orders Dashboard by the state that I select on the Sales Dashboard.
The first thing I’ll do is create a State Parameter:
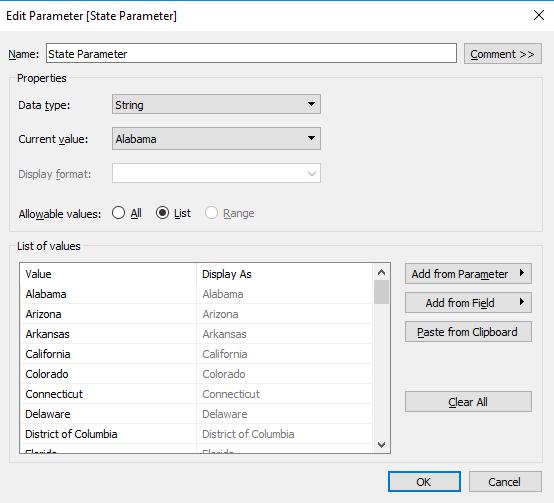
When creating the parameter, it is important to keep the data type of the field you want to filter in mind. The reason being that you will need to ensure that the data type of the parameter matches the data type of the field that you want to filter. In this case, the "State" field is a string, so I’ve created the parameter as a string.
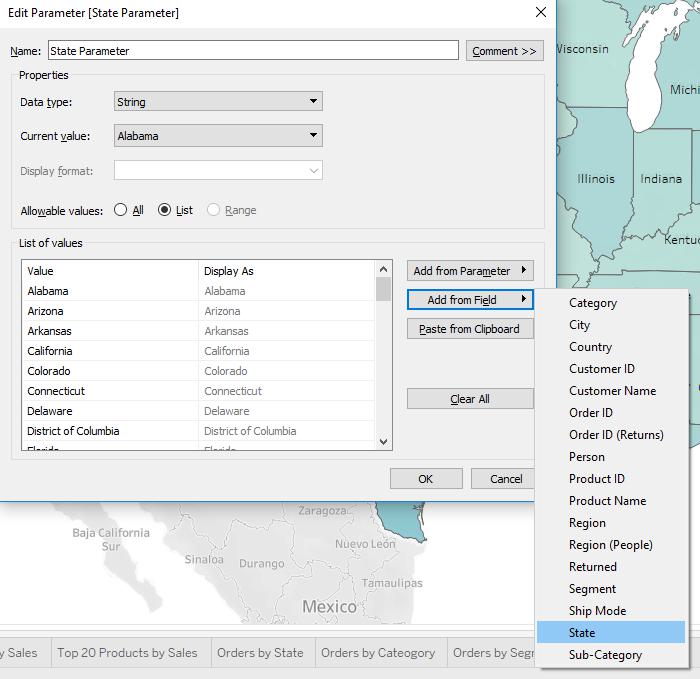
The other settings are not as rigid and can be set based on what makes the most sense for your use case. I’ve decided to use "List" as the "Allowable Values" and created the "List of Values" using the "Add from Field" button the right-hand side.
Now that the parameter is created, we can go ahead and create the parameter action.
The new action needs to be created from the Sales Dashboard.
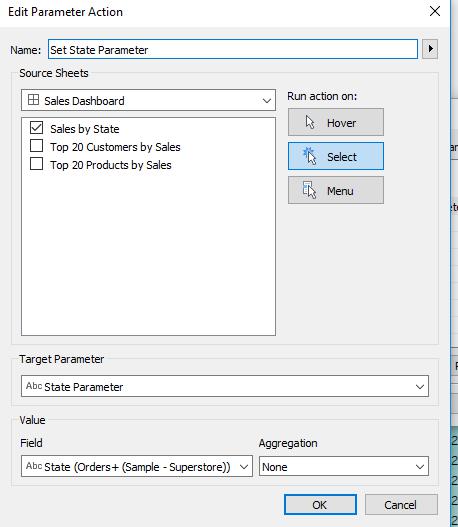
The Source Sheet should be the map which is the Sales by State sheet.
I want the action to work when a state is selected, so I’ve chosen Select as the Run action on: setting.
I’ll set the Target Parameter to the State Parameter since that is the field that I want to update based on the selection.
The field that I want to use to update the State Parameter is found in the Field drop down in the Value section of the menu. I’ve chosen the State field with no aggregation.
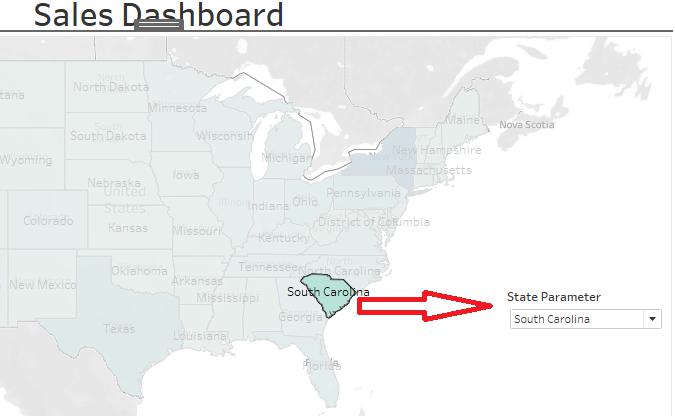
Now when I select a state, I see the parameter update with my selection.
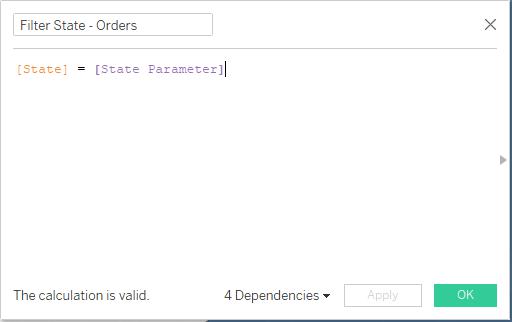
The last step is to filter the Orders Dashboard.
To do this, I created a calculated field to check if the State on the Orders Dashboard is equal to the State Parameter:
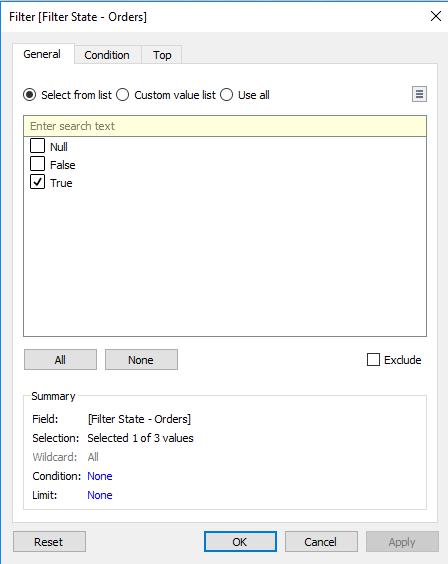
All that’s left is to add the new calculated field to the filter shelf of each sheet on the orders dashboard and select "True" as the value:
Now any selection you make in the map on the Sales Dashboard will automatically update the Orders Dashboard!
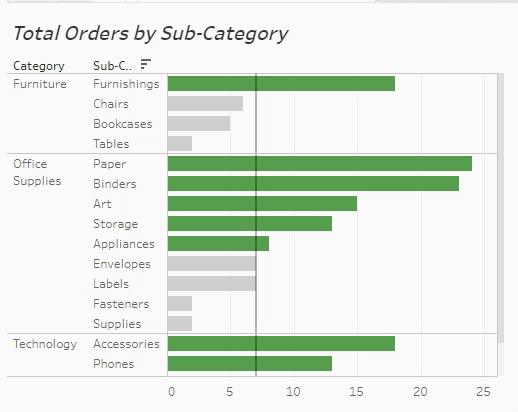
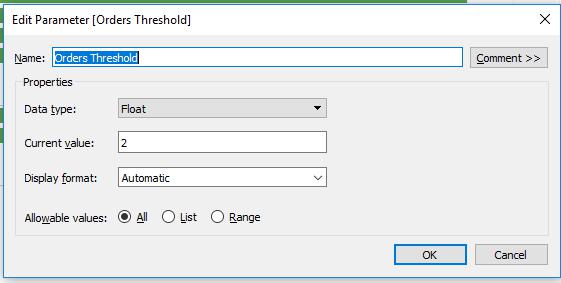
Another cool use of parameter actions is with conditional formatting. Using a parameter action, you can set a “threshold” in which you color your visuals by. I used the Total Orders by Sub-Category bar chart to illustrate how this is done.
Create another parameter. I’ve called this one Orders Threshold:
Create another calculated field. This one should compare the distinct count of order IDs to the newly created threshold.
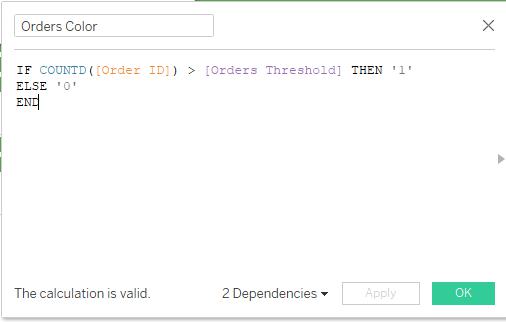
What this does is return a ‘1’ if the count of orders is greater than the threshold and a ‘0’ otherwise.
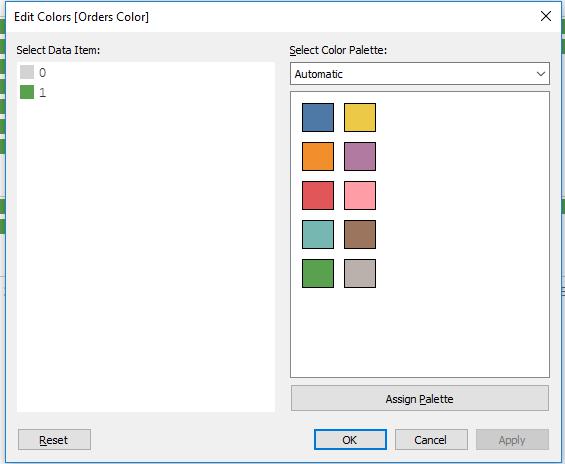
Now you can add this field as color to the marks card and set the colors to represent values below and above the threshold.
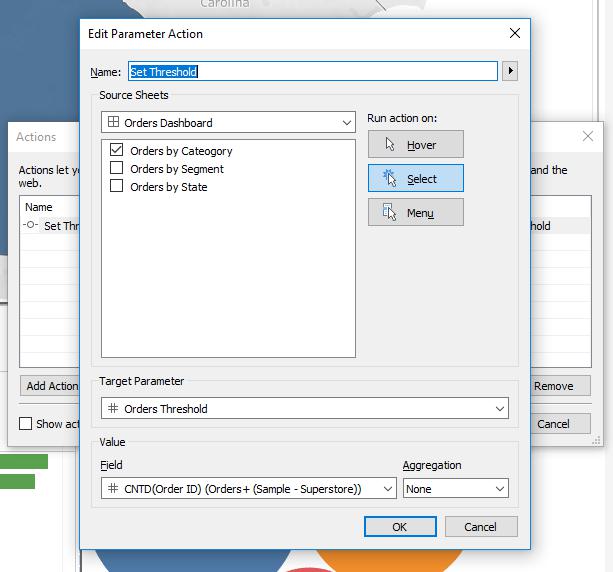
The last step is to create the parameter action on the Orders Dashboard.
Here, I’ve set the action to select, the target parameter to the newly created Orders Threshold, and the value that I want to populate that parameter with is the CNTD(Order ID).
Show/Hide Containers
Personally, the ability to show/hide entire containers is something that I’m excited about. A lot of us have been using ‘hacks’ to get a similar result for years and it seems that Tableau has finally listened and released an out-of-the-box version.
Getting this to work is as simple as adding a floating container (the show/hide functionality only works for floating containers) to your dashboard and placing any sheets/objects in that container that you wish to hide.
Using the container menu, select Add Show/Hide Button.
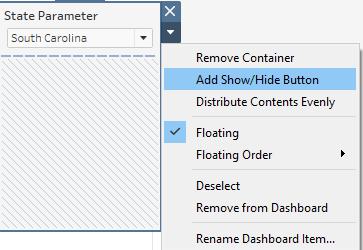
A new icon will be added that controls the show/hide action. You can drag the icon anywhere on the dashboard and Tableau gives you the ability to customize it as you see fit.
Double clicking the button or selecting the edit button from the menu lets you see what customization options are available.
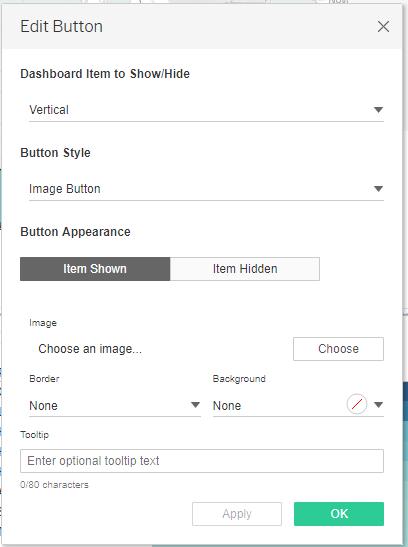
You can do things like change the button style to either an image or text, choose different images for when the container is visible vs. when it’s hidden, and change the border and background style and color. You can also add a tooltip that may help guide users on how to use the button.
All in all, it will look something like this:

Replace Worksheet in a Dashboard
The last feature I’m going to review is the ability to easily replace a worksheet on a dashboard. While this is one of the easier features to use in Tableau, I think it’s a huge time and headache saver. In fact, I used this feature a few times for this blog post!
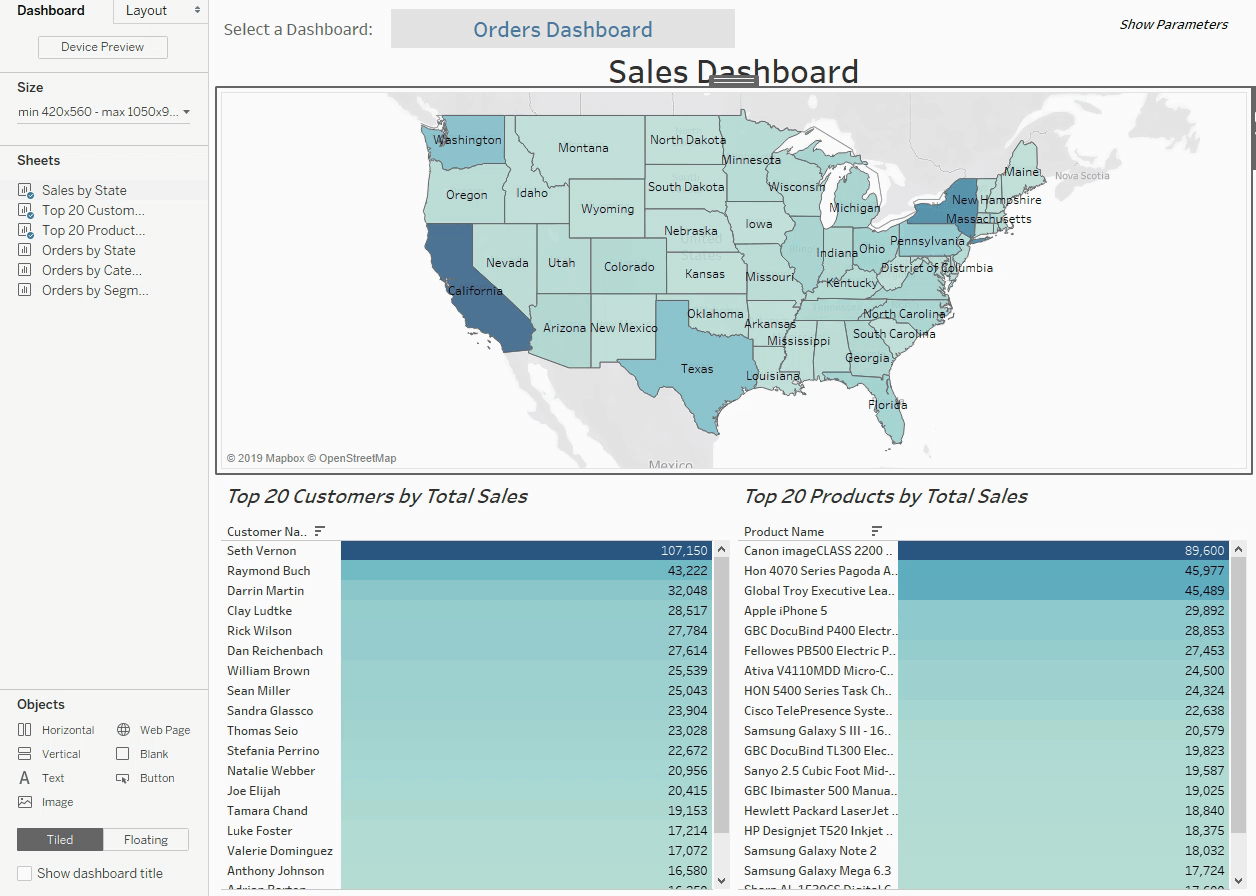
Notice that the layout of the Sales Dashboard and Orders Dashboard are the exact same.
I created the Sales Dashboard first, duplicated it, and just replaced the worksheets with the ones I build for the Orders Dashboard. It’s that easy!
Just select the worksheet that you want to replace and then hover over the worksheet in the sheets section of the sidebar that you want to replace it with. You’ll notice a curved arrow symbol appear next to the sheet.
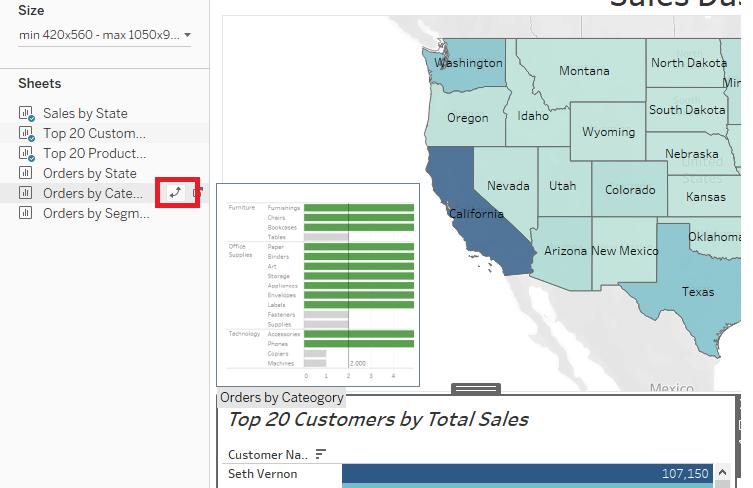
Just click that and you’re done!
These are just some of my personal highlights from the 2019.2 release, but you can look through the full list of updates here.

